bringg
optimization

Empowering dispatchers to optimize hundreds of orders with confidence

Role: UX , UI, Research, Product.

Platform: SaaS (B2B)

2019-Present

Background

01

overview

Subheadline

Current Experience Challenges

Our route optimization feature suffers from a steep learning curve that creates barriers for new users while frustrating experienced ones. The current interface overwhelms users with complex multi-step processes that feel disconnected and unclear. Users struggle to understand system expectations, leading to task abandonment and decreased confidence in the platform's capabilities.

RO - Route Optimization: Calculating optimal delivery routes while managing multiple constraints through an intuitive user journey.

Driver Assignment Flow

When users interact with the order selection interface, contextual guidance appears to help them understand driver selection criteria. The experience reduces decision paralysis through clear visual indicators and smart defaults.

Scheduling Interface

The system empowers users with flexible scheduling options while providing intelligent suggestions. Users can confidently choose manual selection or trust automated recommendations, with clear explanations of how each choice impacts their workflow.

Processing Transparency

Before processing begins, users receive a comprehensive yet digestible summary that builds confidence in their selections. The optimization visualization keeps users engaged and informed about system progress, eliminating uncertainty about wait times.

Results Presentation

Results are presented through progressive disclosure, allowing users to grasp high-level outcomes before diving into details. The preview functionality creates a natural exploration path that encourages deeper engagement with optimization insights

Challenges

Subheadline

Primary Pain Point

The optimization wizard creates unnecessary cognitive burden through its multi-step complexity and lack of contextual guidance. Users abandon tasks mid-flow due to unclear system expectations and overwhelming interface elements, resulting in reduced feature adoption and increased support tickets across our client base.

Goal

Reduce user task completion time by 40% while improving first-time success rates from 45% to 80%, creating a more intuitive optimization experience that builds user confidence and encourages deeper platform engagement.

Strategic Objectives

  • Implement progressive disclosure patterns to reduce initial interface complexity.
  • Design contextual guidance systems that adapt to user expertise levels.
  • Create unified workflows that accommodate diverse use cases without cognitive overhead

How we worked

02

Discovery Process

Comprehensive user research combining behavioral analysis, competitive benchmarking, and iterative testing to create data-driven design solutions.

Discovery
and
UX RESEARCH

We enhance user experiences through intuitive UI/UX design, ensuring seamless interactions that delight users and meet your business objectives.

User Frustration Points

Four critical usability barriers hindering user success and adoption
  • Resource Awareness Gap: Users feel uncertain about available resources during optimization setup. The lack of clear resource status creates hesitation and second-guessing, disrupting the natural flow of route planning and reducing user confidence in optimization outcomes.
  • Workflow Complexity: Our attempt to serve diverse use cases through a single interface has created cognitive overhead. Users must navigate unnecessary complexity regardless of their specific needs, leading to longer learning curves and increased error rates across all user segments.
  • Scheduling Constraints: The current rigid approach to time windows forces users into suboptimal workflows. This inflexibility creates frustration and workarounds, preventing users from achieving their desired optimization outcomes and reducing overall satisfaction.
  • Performance Visibility: Users lack visibility into whether their optimizations meet business objectives. Without clear performance feedback and accessible adjustment mechanisms, users cannot iterate effectively, limiting their ability to improve results over time.

System Foundation

The optimization wizard requires seamless data orchestration that remains invisible to users while powering intuitive interactions. Our architecture prioritizes user mental models over system complexity, ensuring that powerful backend capabilities translate into effortless frontend experiences that feel natural and responsive.

Results Dashboard

Results presentation follows established information hierarchy principles, surfacing the most critical KPIs first while providing clear pathways to detailed insights. This approach reduces cognitive load while enabling thorough analysis when needed.

Final Design

03

DESIGN

The redesigned optimization wizard transforms complex route planning into an intuitive experience, empowering users to achieve optimal delivery outcomes with minimal effort.

Solution Design

Subheadline

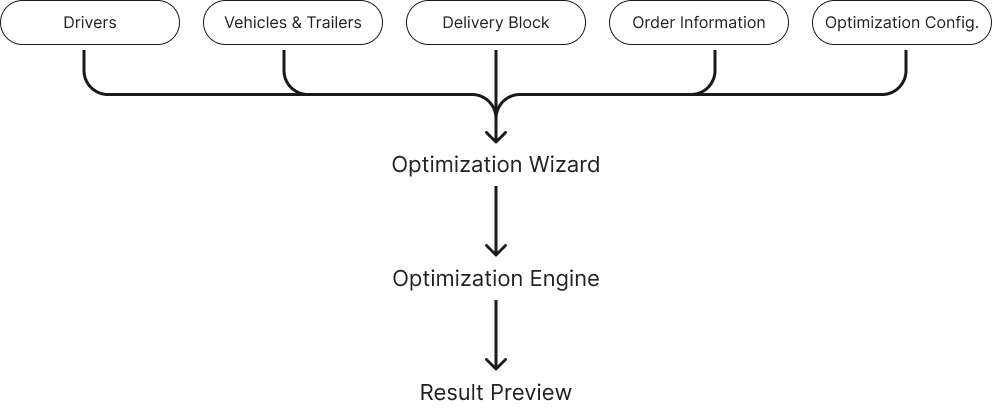
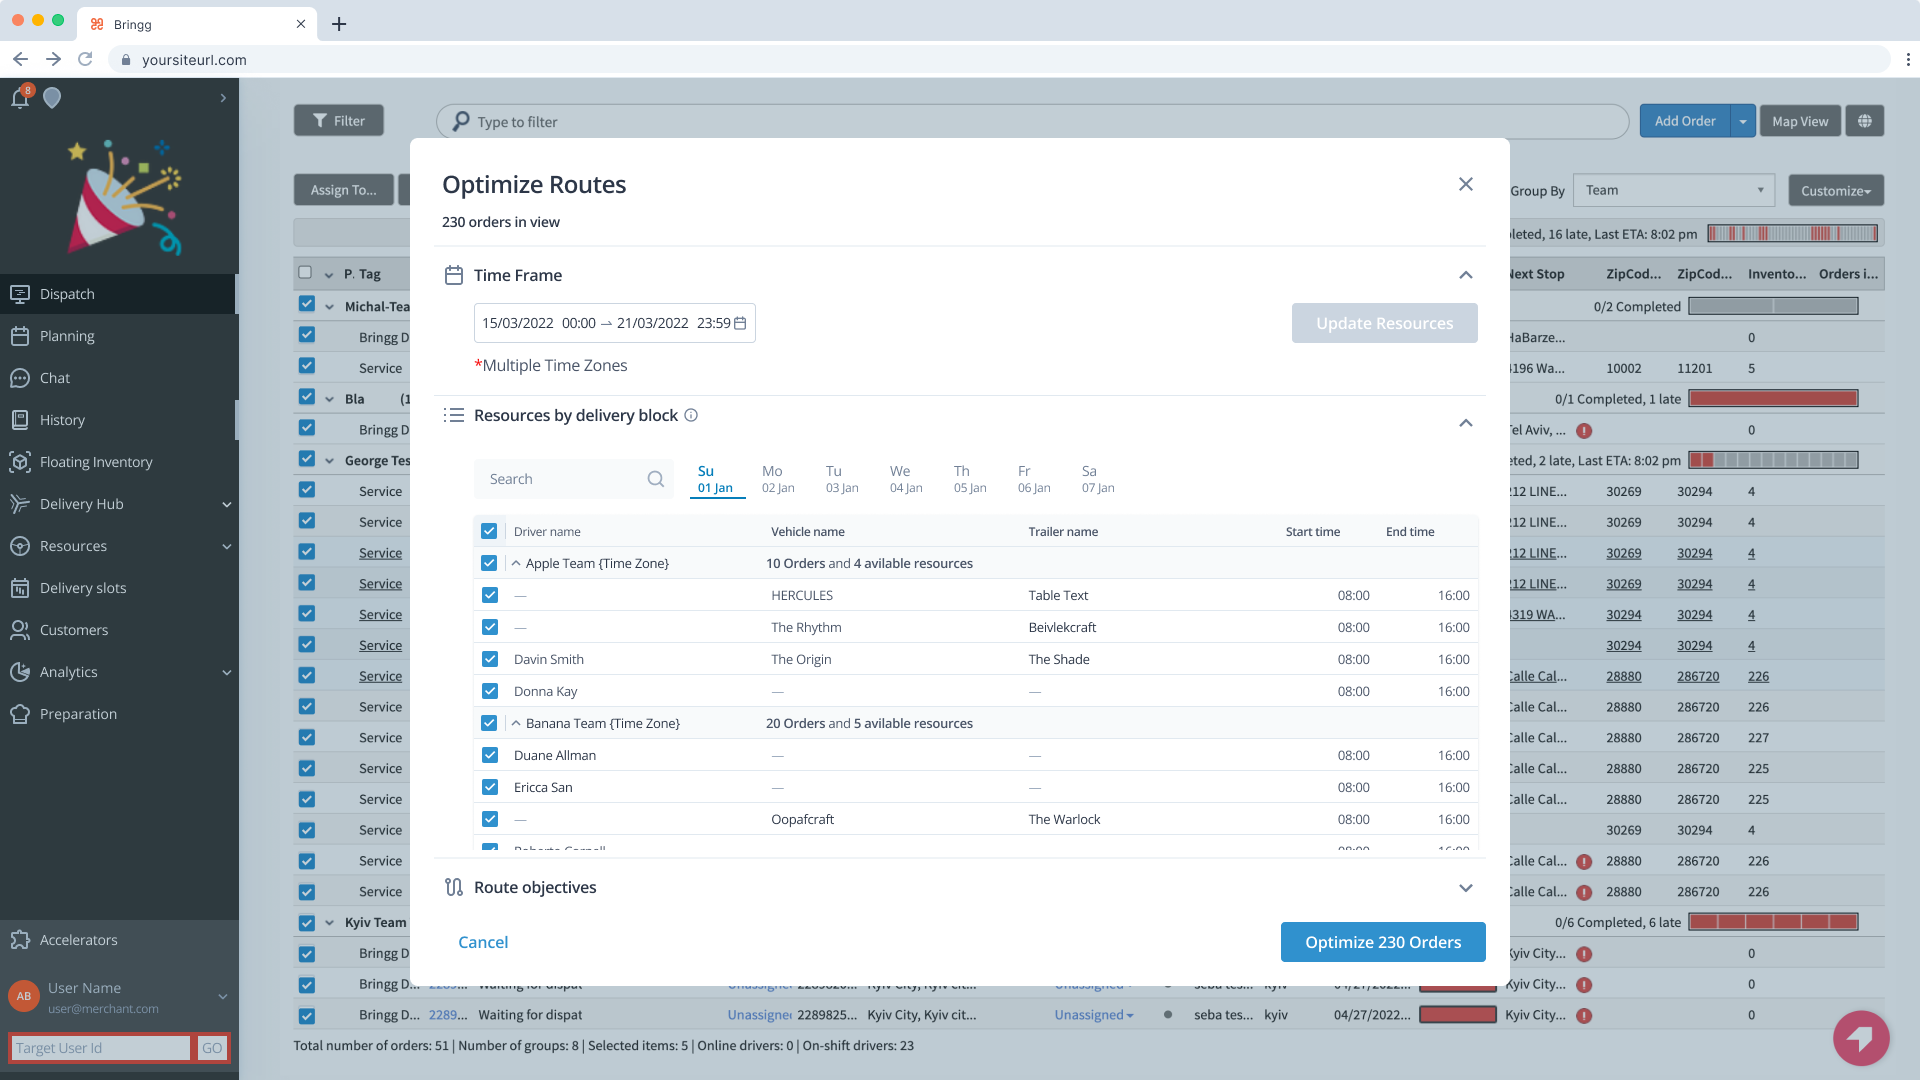
Resource Management Flow

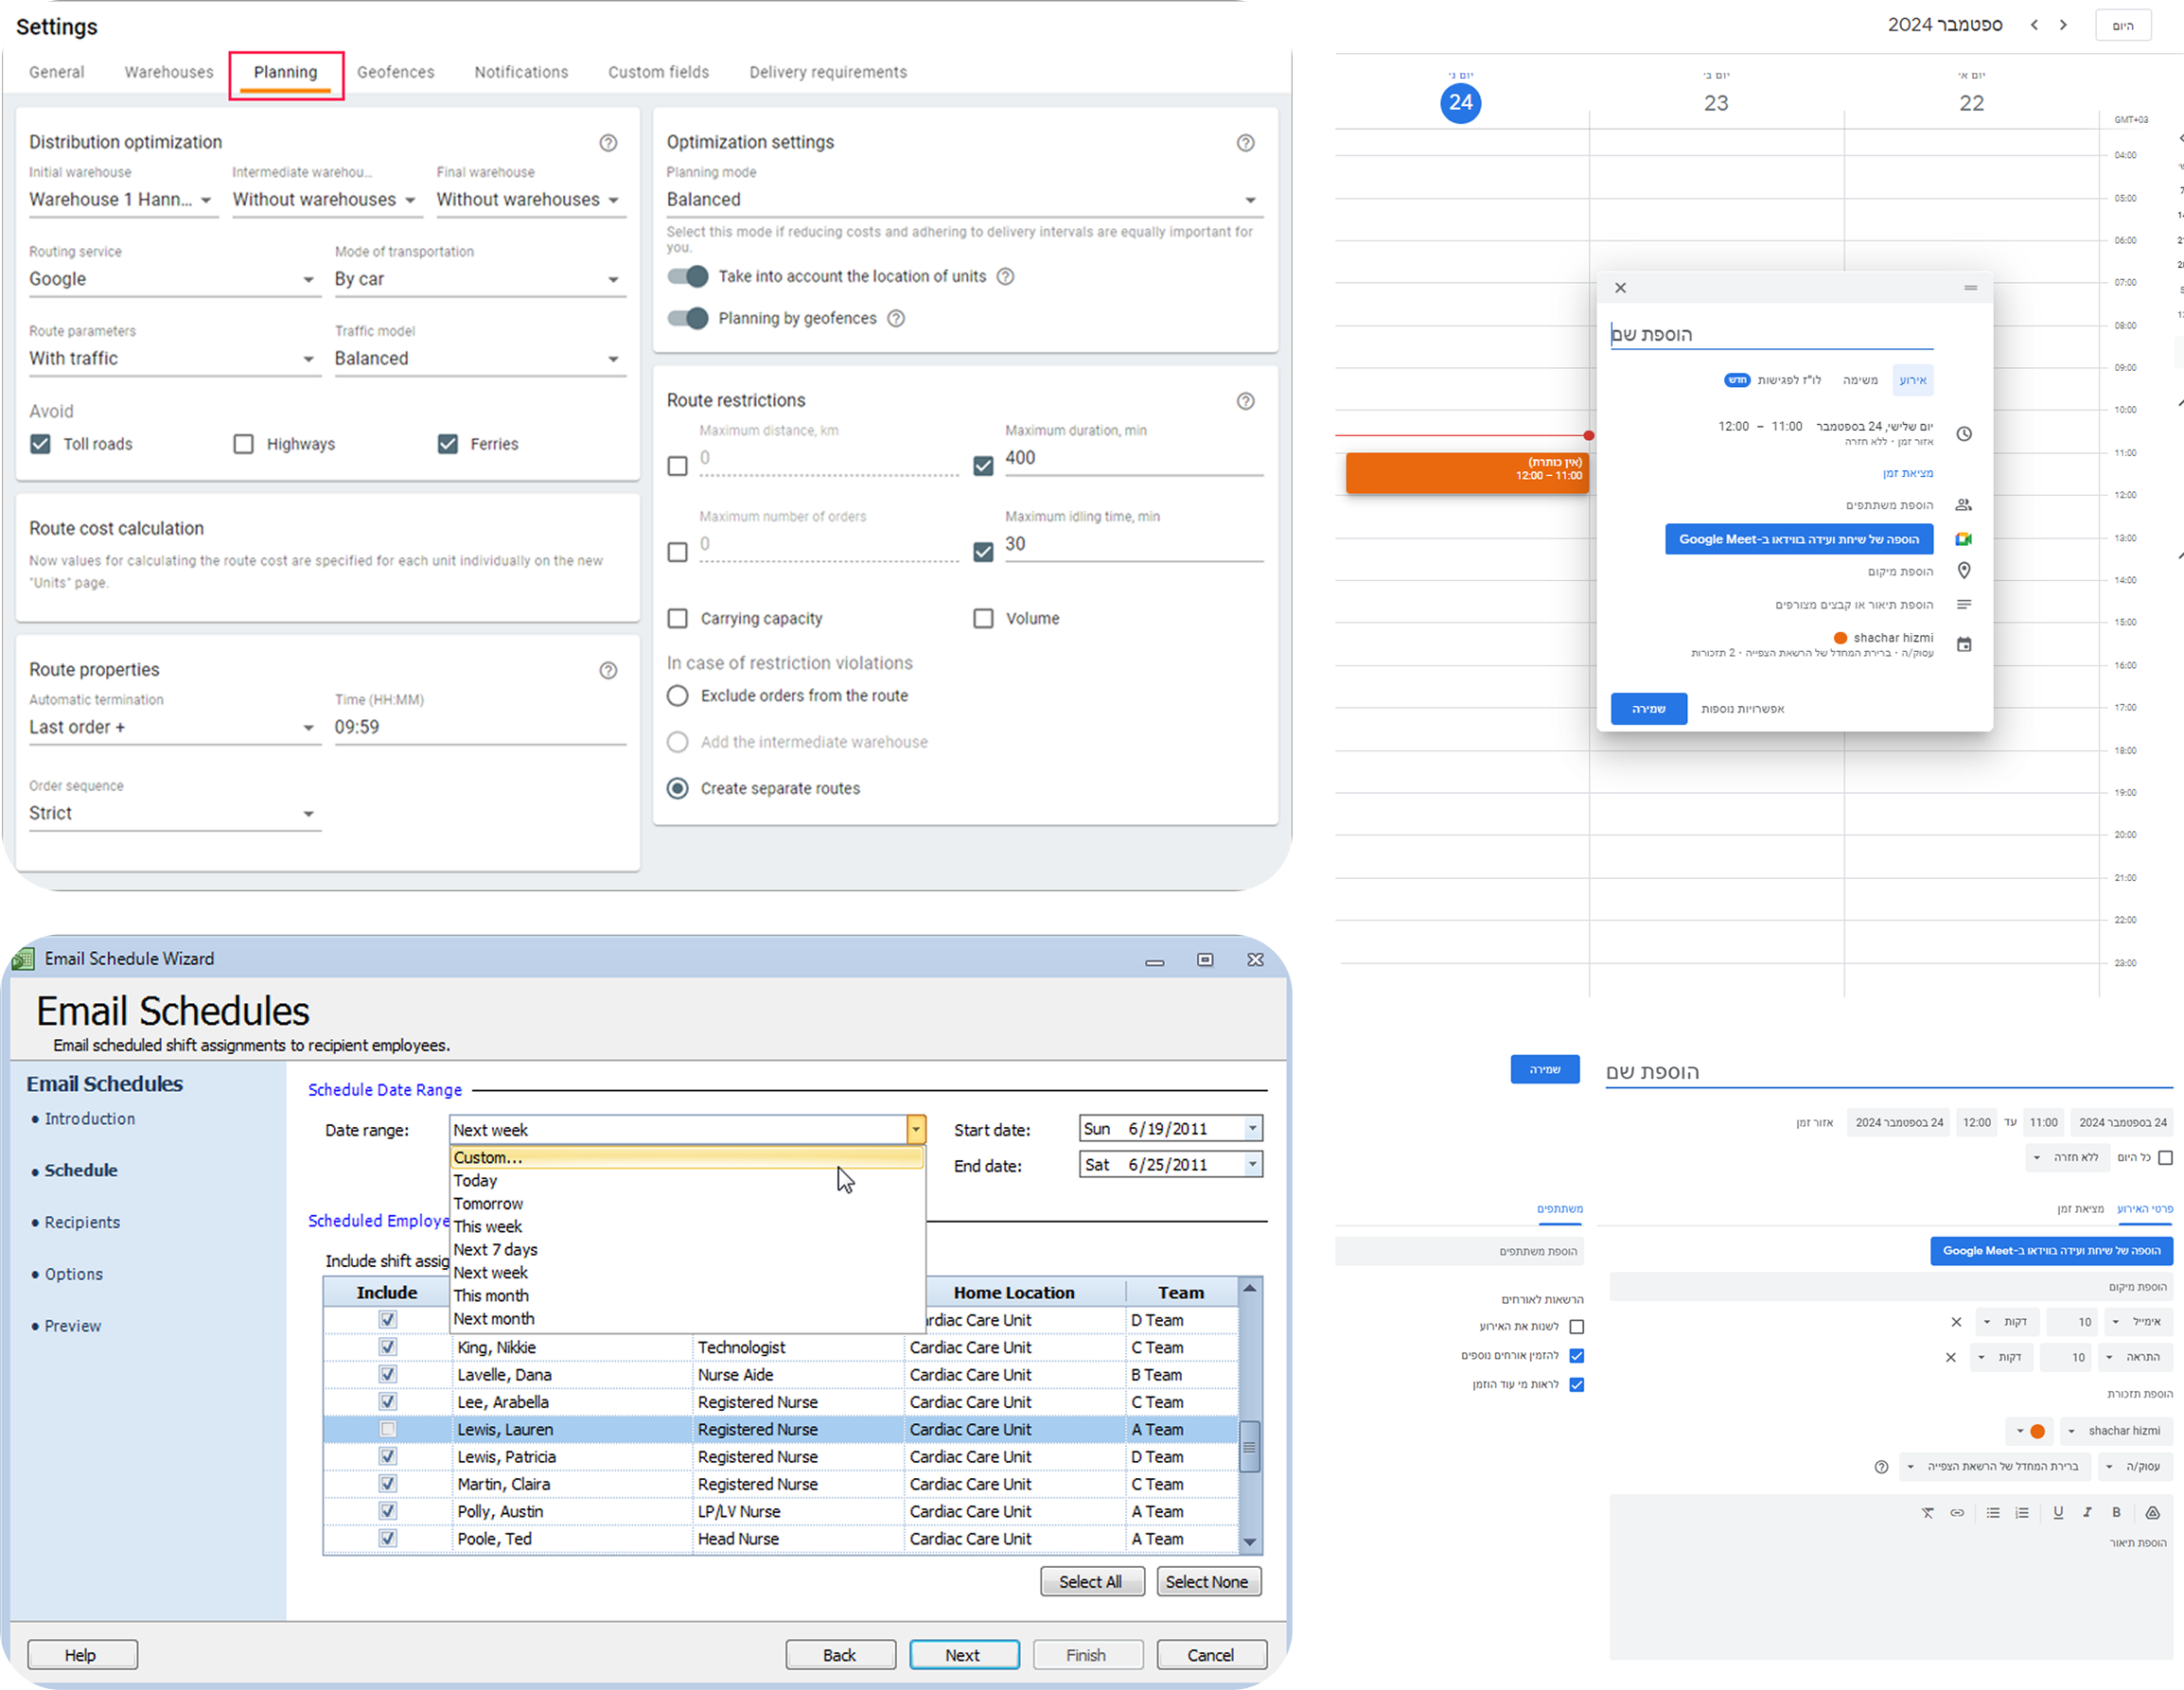
Enhanced user orientation through clear progress indicators and logical information grouping. The segmented approach prevents users from feeling lost in complex forms while smart defaults reduce initial setup friction and build early confidence.

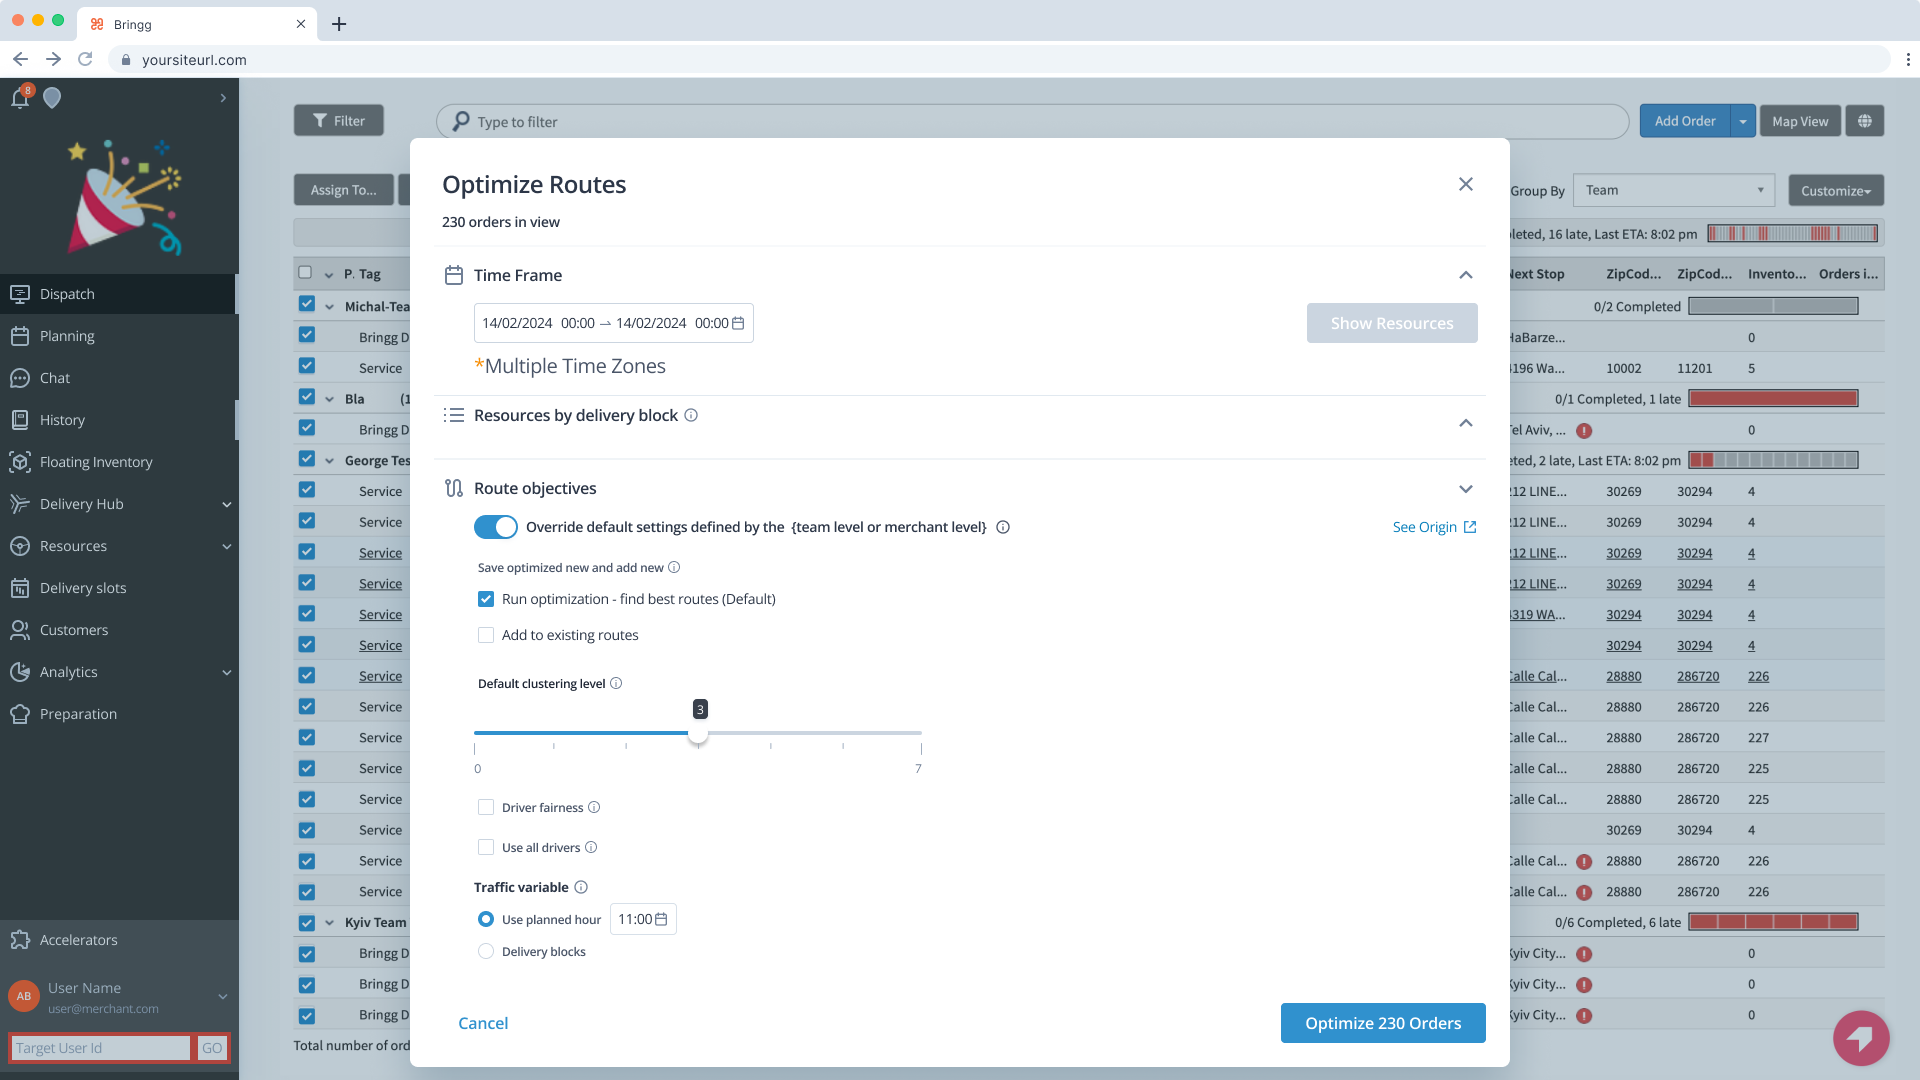
Objective Configuration

Simplified feature discovery through progressive disclosure and clear visual hierarchies. Users can access basic functionality immediately while advanced options remain discoverable without cluttering the primary interface.

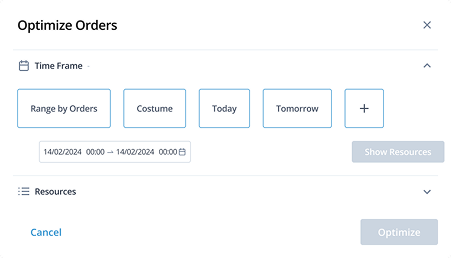
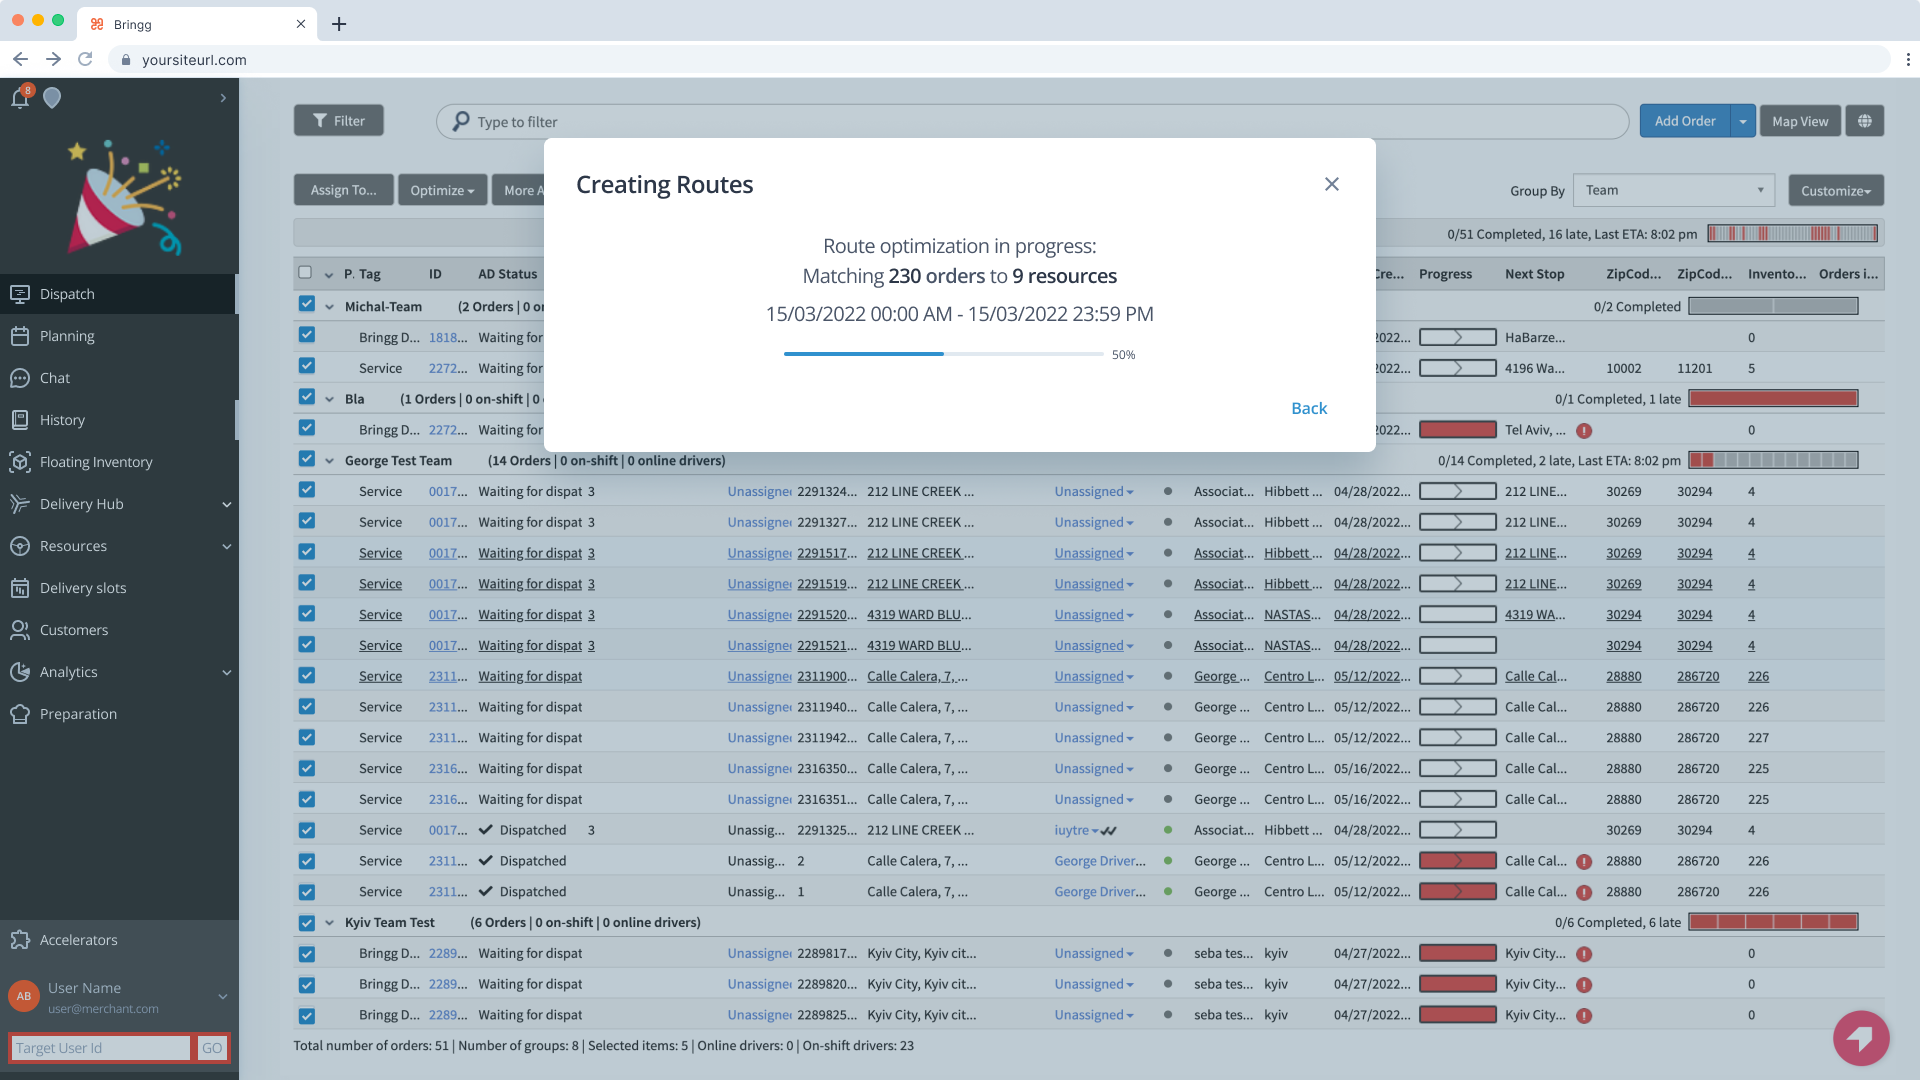
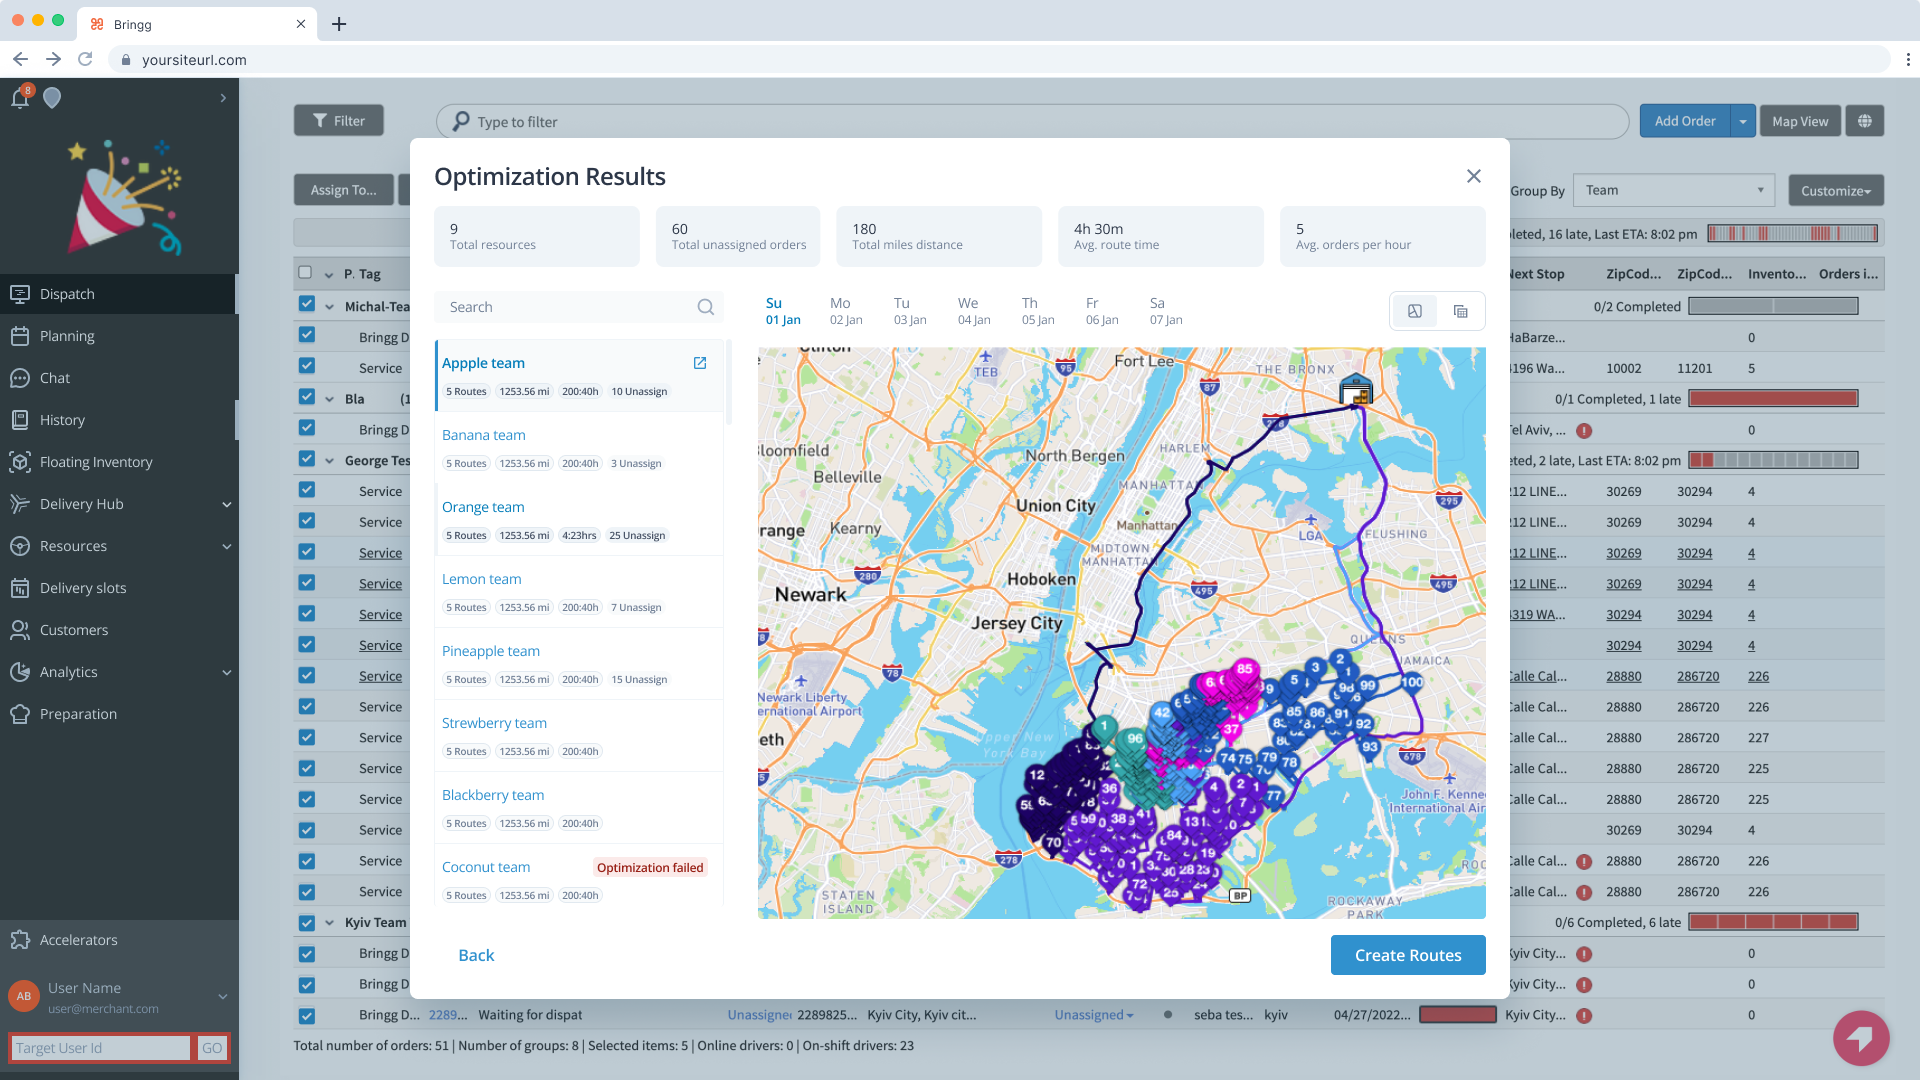
Route Generation Process

Transparent process visualization helps users understand system actions and build trust in optimization outcomes. Clear element identification reduces uncertainty about what the system is processing.

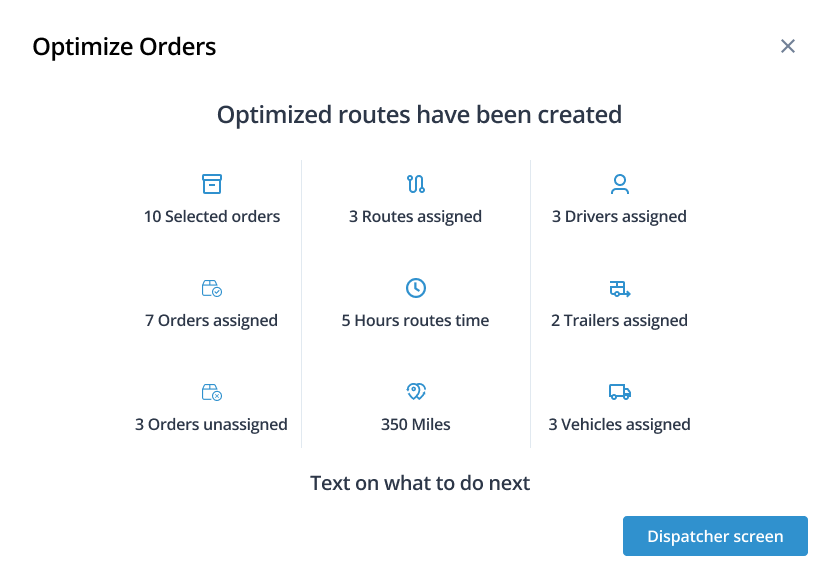
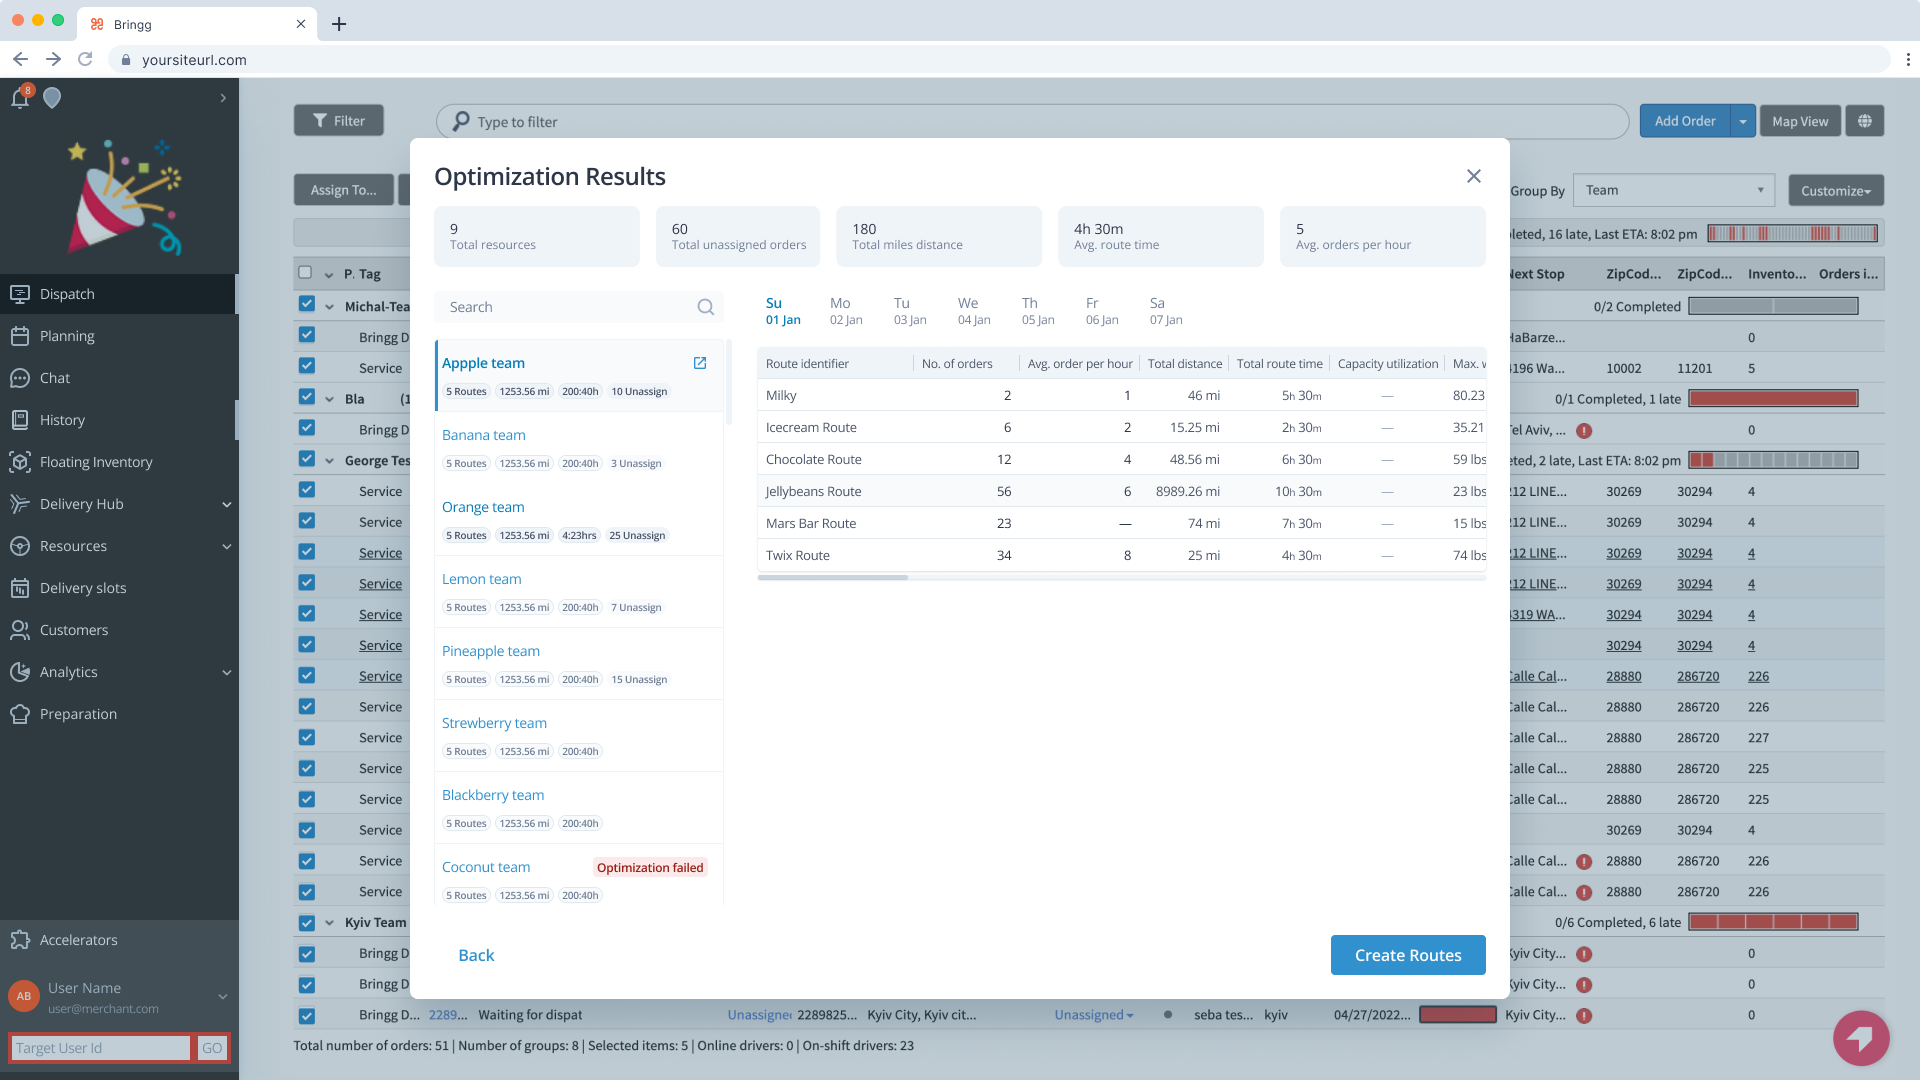
Data Table Interface

Comprehensive improvements focus on reducing cognitive load through smart search functionality and visual result indicators. The hierarchical information structure allows users to efficiently navigate from overview to detail without losing context.

Geographic Visualization

Proposed spatial visualization would bridge the gap between abstract route data and real-world geography, significantly improving user comprehension and decision-making speed. This enhancement would reduce the friction of switching between multiple interfaces while maintaining workflow continuity.

bringg
analytics

impact

View work